

The Automotive Aftermarket Parts industry is a secondary industry serving the repairs and maintenance of vehicles. The market is generally split into two groups – OEM network and independent aftermarket (IAM). IAM ecosystem constitutes of generic manufacturers who produce aftermarket parts, independent wholesalers/distributors, online distributors & retailers and workshops & DIYers.
The retailers and workshops use a B2B E-commerce platform for placing orders for parts & supplies and wholesalers/distributors deliver them in the stipulated timelines. The B2B E-commerce platform generates exponential data such as customer data, product information, pricing data, and order details. All this data that may exist as separate siloes but have the potential to provide significant insights if considered together. Aftermarket wholesalers/distributors can make better business decisions for superior customer delight, driving revenue growth and improving profits by implementing new technology initiatives such as Big Data Analytics tools (like Google Tensor Flow and Apache Spark) to capture and draw hidden patterns and unknown relations.
This paper discusses methods to bring more predictability and to streamline the operations using Big Data Analytics and Machine learning (ML) techniques in different functions of Aftermarket business. Following analytics are discussed.
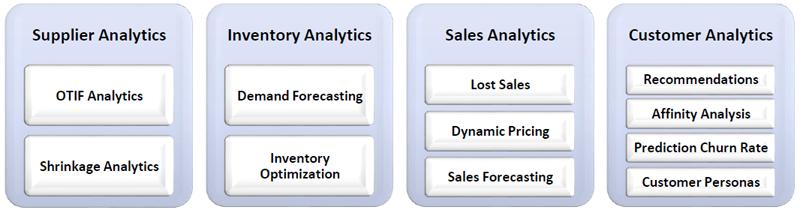
B2B E-commerce platforms can be integrated with firms’ ERP systems bringing focus onto suppliers’ data. Certain key KPIs like OTIF determine the performance of suppliers.
On time (OT) and In Full (IF) are KPIs used to ascertain the performance of suppliers. OTIF is ratio of the number of cases that were supplied exactly as ordered to the number of cases ordered.
A low OTIF usually indicates that sales are being lost and customer satisfaction is low. Improving OTIF will result in
It is therefore important to measure this KPI and ensure that it is being improved.
Some of the reasons for Shrinkage are that when all expected or actual inventory doesn’t get sold due to problems like breakage during shipment or incorrect packaging of goods supplied. The company can use predictive analytics to get insights on which supplies are likely to arrive at wholesaler/distributor in an unusable condition. Then, if patterns emerge, the company could bring up concerns to its suppliers for appropriate actions.
The demand for parts replacement keeps fluctuating due to:
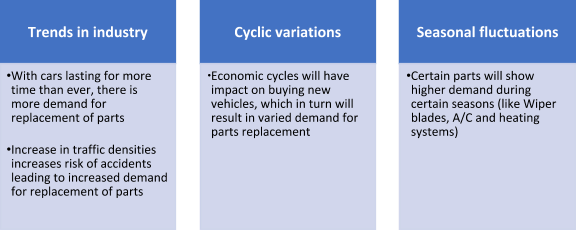
Using the historic order data, predictive models are built through Time Series analysis and probabilistic models, to capture such demand fluctuations to large extent. For each part, such models can be generated and accordingly processes can be built to have requisite quantities ordered. This methodology will do away with traditional forecasting using historical averages. While older models were accurate to a season, newer models will be accurate to a fortnight or even a week, resulting in substantial cost savings.
Shelf space in stores is a precious asset which needs to be used to maximize profitability but at the same time, satisfies customers’ part requirements.
To determine “par levels” (the minimum quantity that must be on hand at all times), flag obsolete items and identify critical parts, the businesses must accurately classify inventory. ABC Analysis, classifies inventory based on priority of each item against other items in Inventory

But such classification is not as straightforward as it sounds. However, usage of ML algorithms for ABC Analysis shall improve accuracy levels to large extent.

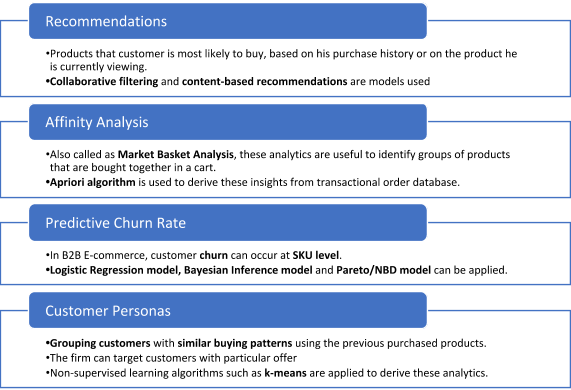
Various Customer analytics like Recommendations, Affinity Analysis, Predictive Churn Rate and Customer Personas will help increase sales and improve the profitability for the firm.
In summary, the aftermarket distributors have access to a lot of data generated from their CRM, ERP, inventory management systems and E-commerce Ordering systems. Using latest technologies like Big Data Analytics and tools like Google Tensor Flow and Apache Spark to generate insights from Suppliers Data, Inventory Data, Sales Data and Customer Data, the firms can take actions to increase sales, improve profitability and customer delight.